
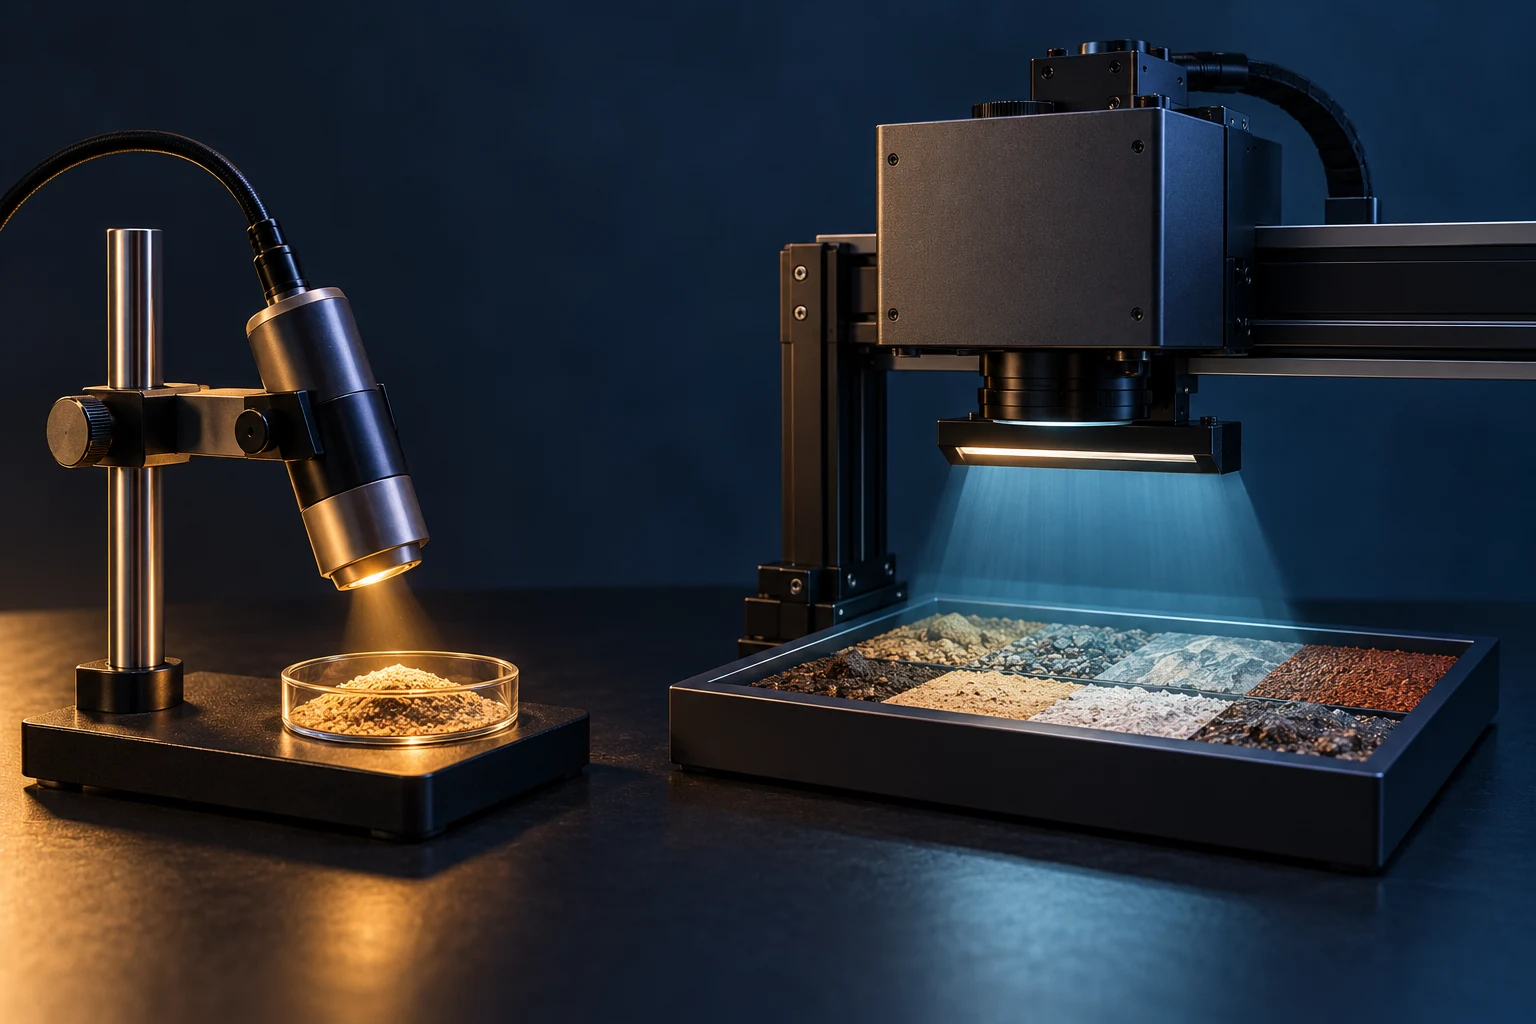
NIR and HSI describe different things
Near infrared, or NIR, describes a region of the electromagnetic spectrum. Hyperspectral imaging describes a way of acquiring spatially resolved spectra. They are not competing categories: an instrument can perform NIR hyperspectral imaging. The practical comparison is usually between a conventional NIR spectrometer that measures a spot or sampling volume and an imaging instrument that records many spectra across a scene.
A point measurement can provide a useful summary of a well-mixed sample. An image can reveal where materials or predicted properties vary, provided the pixels contain enough information and the model is valid at that scale. If the required output is a bulk concentration, the extra spatial dimension may be unnecessary. If the required output is the location of a foreign particle, an average spectrum may conceal it.
Wavelength labels are also used differently across disciplines. BUCHI introduces NIR measurements over roughly 800–2500 nm. Always report the actual instrument range rather than relying on a region name, and check that relevant absorption features fall within it. 1
Understand the information in an NIR spectrum
Many NIR absorption features arise from overtones and combinations of molecular vibrations. Bonds involving hydrogen, including O–H, N–H and C–H, are particularly relevant to common organic samples. The bands are often broad and overlap. Scattering, temperature, particle size and sample presentation can also alter the spectrum, which is why one peak rarely provides a universally reliable concentration measurement. 1
Reflectance measurements also have a sampling depth rather than unlimited access to the interior. Light paths depend on wavelength, absorption, scattering and geometry. A published NIR-HSI experiment in wheat flour investigated the detectability of a buried polylactic-acid target using partial least squares analysis. Its relevance is the need to characterise depth for the actual system, not to assume one penetration depth applies to every food or material. 7
For an imaging application, this leads to a concrete design question: does the feature of interest occupy a sufficient part of the optically sampled region and a sufficient part of a spatial pixel? Increasing model complexity cannot compensate for a signal that the instrument does not measure.
| Question | Conventional NIR spectroscopy | NIR hyperspectral imaging |
|---|---|---|
| What is recorded? | A spectrum from a spot or sampling volume | A spectrum at each spatial sample |
| What spatial output is available? | Usually a sample-level measurement | Maps and regional spectra |
| When is it useful? | Representative bulk composition or identity | Spatial distribution and heterogeneity |
| Does it need calibration? | Yes, for empirical quantitative prediction | Yes, for empirical quantitative prediction |
| What is an independent unit? | A sample, batch or deployment-relevant group | Usually a specimen or group, not every pixel |
| Does imaging guarantee better accuracy? | Accuracy must be measured | Accuracy must be measured |
Define the target before building a calibration
Chemometrics links spectral measurements to properties or categories using statistical methods. A quantitative calibration needs spectra paired with dependable reference values. Specify the target, its units, its reference method and the intended sample population before selecting an algorithm. For example, moisture reported on a wet basis and moisture reported on a dry basis are different targets even if both are called moisture.
Choose calibration samples that cover plausible composition, temperature, particle size, suppliers, batches and seasons. BUCHI's calibration guidance emphasises representative samples and consistent reference measurements. A model trained on a narrow population does not acquire broader validity because it sees more pixels from those same samples. 1
For HSI, align the reference scale with the prediction scale. A laboratory value for an entire sample can support a model using its average spectrum. Assigning that same bulk value to every pixel does not establish that each pixel has that composition. A visually detailed concentration map needs validation that supports local interpretation. This is a methodological consequence of what the labels actually measure.
Explore prediction error and bias
Four synthetic moisture predictions: [8.2, 9.7, 12.1, 14.6] for references [8, 10, 12, 14] % by mass. The slider adds one offset to all predictions. This small example does not establish model performance.
Build a pipeline that can be evaluated honestly
A useful starting point is a transparent baseline. Partial least squares, or PLS, regression is widely used in NIR work to relate correlated spectral variables to a quantitative target through a smaller set of latent components. In the 2018 wheat-flour protein study by Morales-Sillero and colleagues, PLS models were evaluated using both cross-validation and an independent validation set. The NIR-HSI and conventional instruments performed similarly over their shared wavelength range in that experiment. 2
Treat preprocessing as part of the pipeline. Smoothing, derivatives, scatter corrections, scaling, wavelength selection and the number of PLS components can all affect results. Choose settings using training data and internal validation. Any transform that learns a mean, scale, reference spectrum or selected wavelengths must learn it without access to the assessment data.
Record the complete sequence, not just the final model name. A small improvement after trying many alternatives may reflect selection of a fortunate validation score. Cawley and Talbot demonstrated how optimisation of a noisy model-selection criterion can overfit the selection process itself. An untouched assessment set or properly nested evaluation helps distinguish this from a reproducible improvement. 3
Split data according to the intended use
Decide what a genuinely new observation means. For future production batches, separate batches. For new fruit, plants or kernels, keep each object together. For mapping new fields, consider field or spatial separation. Randomly dividing neighbouring pixels can place near-duplicates in training and assessment sets and make a score appear stronger than performance on a new object.
Mahoney and colleagues compared validation methods in simulations of spatially structured data. Their study found that spatial approaches generally improved performance estimates, particularly when held-out regions included exclusion buffers. Applying that finding to HSI is a reason to match separation to the deployment question, not a rule that one buffer size suits every image. 4
Use internal validation to tune the pipeline and an independent set for a final assessment when feasible. Report the number of independent samples or groups, their origin and concentration range. Varoquaux's experiments in another imaging field show how small datasets can leave substantial uncertainty in cross-validation estimates. Millions of pixels do not remove that uncertainty when they come from only a few independent specimens. 5
Calculate error in meaningful units
For n assessment samples, RMSEP = √[(1/n) Σ(ŷᵢ − yᵢ)²]. Here y is the reference value and ŷ is the prediction. Mean prediction bias is (1/n) Σ(ŷᵢ − yᵢ). Both retain the target's units. A coefficient of determination alone cannot show whether errors are acceptable for a particular decision.
The example below uses synthetic moisture values, expressed as percentage by mass, and calculates errors in percentage points. It requires Python 3 and only the standard library. Its four predictions are deliberately imperfect. They give an RMSEP of 0.354 percentage points and a positive bias of 0.150 percentage points. The sample count is too small for any performance claim.
Inspect residuals across the target range and by batch, temperature or other important conditions. A published study of DON-contaminated wheat reported a substantially larger prediction error on an independent set than in its internal assessment. That result is specific to its data, but illustrates why an internal score and an external score answer different questions. 6
Sources: [6]
Choose the measurement for the decision
For routine bulk composition, a conventional spectrometer may offer a simpler sampling and processing workflow. For spatial heterogeneity, particle detection or the distribution of predicted properties, HSI supplies locations as well as spectra. These are practical selection criteria, not a ranking of technologies. The wheat-protein comparison demonstrates that imaging did not automatically produce superior quantitative performance. 2
Before routine use, challenge the system with representative new samples, repeat acquisitions and plausible changes in presentation. Establish how to identify out-of-range spectra and what happens when a prediction cannot be supported. Keep raw data, reference values, grouping information and the fitted preprocessing parameters together so that a result can be audited.
The strongest application is one with a clear decision and measured error tolerance. For sorting, assess the consequences of missed and false detections. For concentration, compare prediction error with the relevant specification margin and reference-method uncertainty. A model may still be useful when it cannot replace a laboratory reference method, provided its role and limitations are demonstrated.
- Define the target and independent sample before collecting training data.
- Keep related pixels and repeated measurements in the same split.
- Select preprocessing and model settings inside the training process.
- Report external errors, bias and failure conditions in usable units.
Run the example
Prerequisite: Python 3. Examples use synthetic inputs to explain the calculation. Save the snippet as example.py and run python3 example.py.
from math import sqrt

# Synthetic moisture values, expressed as percentage by mass.
reference = [8.0, 10.0, 12.0, 14.0]
prediction = [8.2, 9.7, 12.1, 14.6]
residuals = [p - r for p, r in zip(prediction, reference)]
rmsep = sqrt(sum(e * e for e in residuals) / len(residuals))
bias = sum(residuals) / len(residuals)
print(f'RMSEP: {rmsep:.3f} percentage points')
print(f'Bias: {bias:+.3f} percentage points')
Verified output
RMSEP: 0.354 percentage points
Bias: +0.150 percentage points
Frequently asked questions
Is NIR spectroscopy the same as hyperspectral imaging?
No. NIR identifies a wavelength region. HSI acquires spatially resolved spectra and may operate within the NIR region.
Does HSI always predict composition more accurately?
No. Accuracy depends on the measured signal, sampling, references and validation. Imaging adds spatial information, which may or may not improve the required prediction.
Why is PLS regression used for spectra?
PLS relates correlated spectral variables to a target through latent components. The number of components still needs to be chosen without using assessment data.
Can I randomly split pixels from the same object?
That may overestimate performance on new objects. Choose grouping and spatial separation that reflect the intended deployment.
Is a high R² enough?
No. Report errors and bias in target units, check residuals and describe the independent assessment population and its size.
Can a bulk calibration produce a validated pixel map?
Not by itself. A bulk reference validates a sample-level target; local concentration claims require evidence that supports the spatial scale.
References and further reading
- BUCHI: Near infrared spectroscopy
- Morales-Sillero et al. (2018): Wheat protein by NIR-HSI and conventional NIR
- Cawley and Talbot (2010): Over-fitting in model selection
- Mahoney et al. (2023): Spatial cross-validation simulations
- Varoquaux (2018): Cross-validation uncertainty at small sample sizes
- Standardisation of NIR-HSI for DON-contaminated wheat samples
- Laborde et al. (2020): NIR-HSI penetration-depth study in wheat flour