
Choose the failure you need to detect
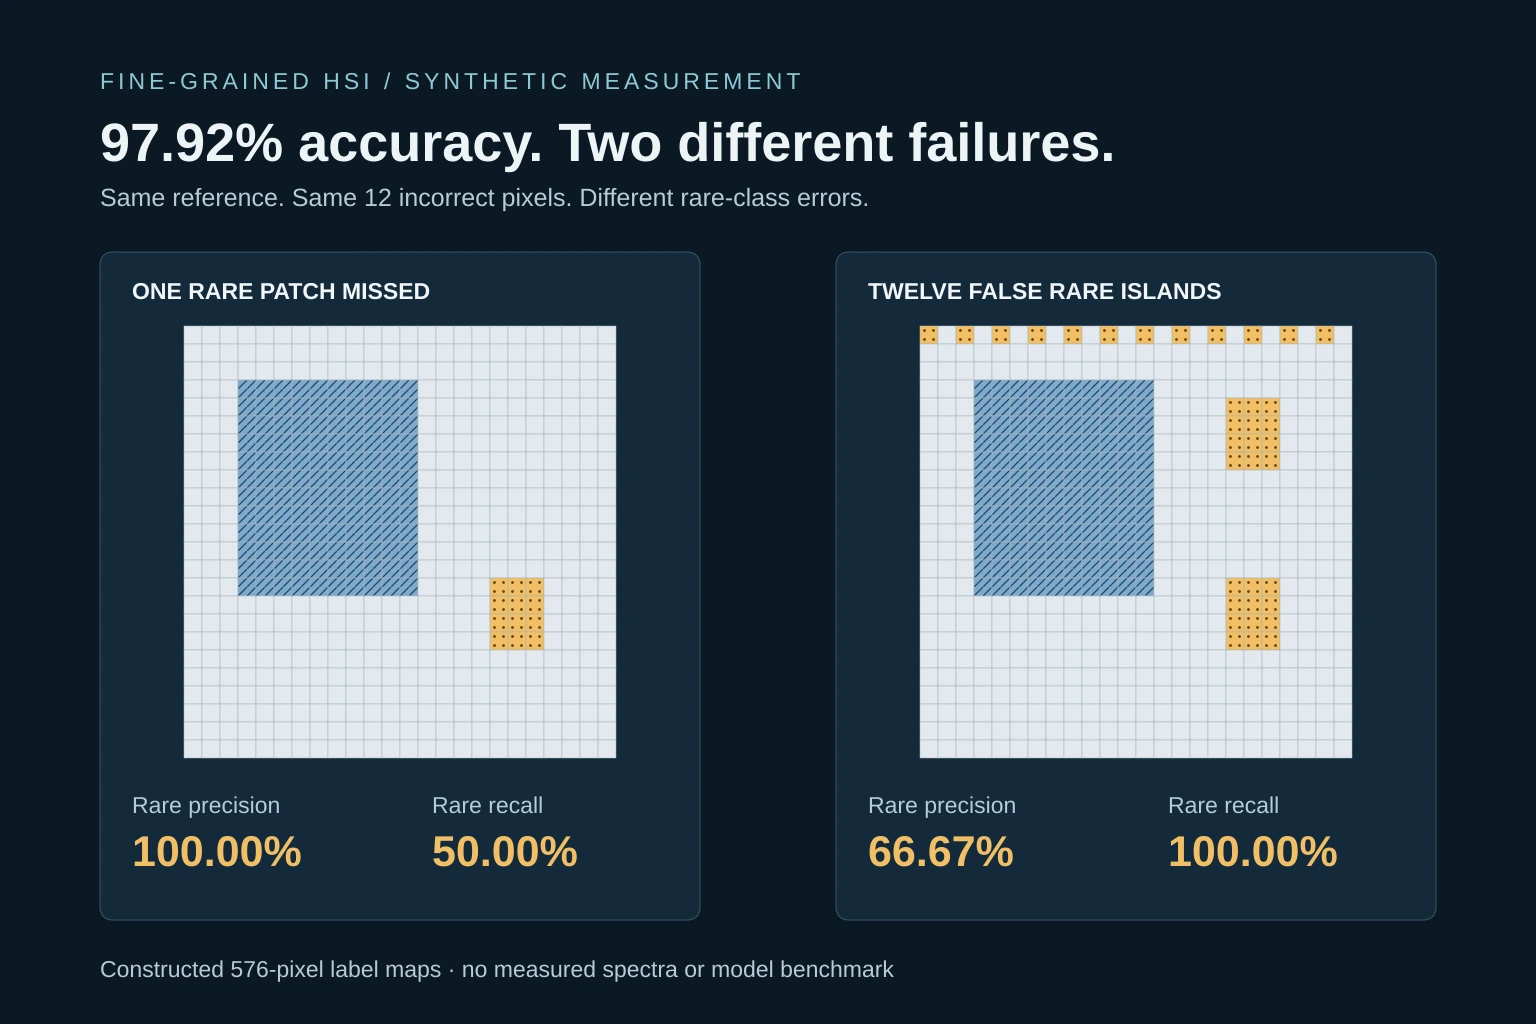
Two classification maps can receive the same overall accuracy and fail in different ways. One can omit a rare material; another can detect all of it while inventing scattered occurrences elsewhere. A third can preserve class areas while putting their boundaries in the wrong place. Each failure changes what the map is useful for.
This guide concerns hard, single-label hyperspectral classification maps. It does not evaluate reconstructed spectra, calibrated reflectance, abundance estimates or probability calibration. Its aim is to make a map-quality report explain what was retained, missed, added and displaced.
The smoothing example explains one mechanism that removes small regions. Here, a separate synthetic workbench holds the reference fixed and introduces controlled errors. No spectral measurements, trained model or real benchmark result is represented.
Read the confusion matrix before the headline score
Use an explicit orientation: reference classes are rows and predicted classes are columns. Entry Cᵢⱼ counts evaluated pixels whose reference is i and prediction is j. Row totals give reference support; column totals give predicted support. Overall accuracy (OA) is the diagonal sum divided by the total evaluated support. A transposed matrix is valid too, but changes how precision and recall are read. [1]
For a selected class, true positives (TP) lie on its diagonal. False negatives (FN) are the other entries in its reference row; false positives (FP) are the other entries in its prediction column. Recall is TP/(TP+FN), precision is TP/(TP+FP), F1 is 2TP/(2TP+FP+FN), and class IoU is TP/(TP+FP+FN). Each answers a different question. [2] [6]
In remote-sensing terminology, producer’s accuracy corresponds to reference-class recall, while user’s accuracy corresponds to mapped-class precision when the same properly weighted matrix is used. State the orientation rather than assuming a reader will recognise the convention. [4]
| Controlled error | Incorrect pixels | OA | Rare precision | Rare recall |
|---|---|---|---|---|
| Miss one rare patch | 12 | 97.92% | 100.00% | 50.00% |
| Add 12 false rare islands | 12 | 97.92% | 66.67% | 100.00% |
| Shift Region by one pixel | 24 | 95.83% | 100.00% | 100.00% |
Hold the scene fixed and change the error
The workbench contains 576 equal-area pixels: 432 Background, 120 Region and 24 Rare. Rare occupies two separate 3 × 4 patches, together 4.17% of the scene. These are arbitrary class names in a complete synthetic reference. They carry no claim about actual land cover.
The default removes one rare patch, causing 12 false negatives. OA is 564/576, or 97.92%, while rare-class recall is 12/24, or 50%. Choose “False islands” instead: 12 background pixels become rare-class predictions. OA remains 97.92%; rare recall rises to 100%, but precision falls to 24/36, or 66.67%. Equal error counts have concealed opposite operational problems.
Choose “Shift boundary” to translate only Region one pixel to the right. Its mapped area stays at 120 pixels, but 12 reference Region pixels are missed and 12 Background pixels are added to Region. OA is 95.83% and Region IoU is 108/132, or 81.82%. Correct mapped area alone has not established correct location.
One map, three error mechanisms
Compare a missed rare patch, false rare-class islands and a shifted Region boundary. Every result below is calculated from the displayed label maps.
564 / 576 correct pixels. Overall accuracy 97.92%. Rare-class precision 100.00%; recall 50.00%.
| Reference ↓ / Predicted → | Background | Region | Rare | Support |
|---|---|---|---|---|
| Background | 432 | 0 | 0 | 432 |
| Region | 0 | 120 | 0 | 120 |
| Rare | 12 | 0 | 12 | 24 |
| Class | Reference n | Predicted n | Precision | Recall | F1 | IoU |
|---|---|---|---|---|---|---|
| Background | 432 | 444 | 97.30% | 100.00% | 98.63% | 97.30% |
| Region | 120 | 120 | 100.00% | 100.00% | 100.00% | 100.00% |
| Rare | 24 | 12 | 100.00% | 50.00% | 66.67% | 50.00% |
Macro precision: 99.10% across 3 defined classes. Macro recall, F1 and IoU each include all three reference classes in this scene.
Boundary and connected-region diagnostics
Region mask IoU: 100.00%. Region Boundary IoU: 100.00% (40 / 40 band pixels; width 1 pixel).
Rare-class components (4-neighbour): reference 2, prediction 1. Component sizes in pixels: reference [12, 12]; prediction [12].
The inner band is mask minus square-neighbourhood erosion, with outside-image background. These connected components are raster regions, not labelled physical objects.
What if the rare class had a different prevalence?
At a hypothetical 5% rare-class prevalence, overall accuracy would be 97.50% and rare-class precision 100.00%. Macro recall remains 83.33%. These are reweighted proportions, not additional evaluated pixels.
Reference-row conditional error rates stay fixed. The non-rare remainder is divided Background:Region = 18:5. The displayed maps and count matrix stay unchanged. Try the False islands preset to see how prevalence changes precision. This is neither a field-area estimator nor a domain-shift guarantee.
Calculation conventions and limits
All 576 pixels are labelled and evaluated; no missing-data mask is used. Three fixed classes are included. Undefined ratios are displayed as Undefined and excluded from the relevant macro mean. A reference class with no predictions retains zero recall, F1 and IoU.
Errors are deterministic: remove rare pixels in row-major order, add isolated rare labels along the top and near-bottom rows, and translate Region to the right. No smoothing, spectral input, training, uncertainty interval or instance matching is performed.
Boundary bands use Chebyshev-distance square erosion of radius d. An empty band union is undefined. Region is the only class selected for the boundary diagnostic. Changing band width changes the measurement support.
Source definitions: precision, recall and averaging; Boundary IoU. The article explains sampling and reference uncertainty separately.
Separate equal-class summaries from area-weighted accuracy
Macro averaging gives each included class equal weight. In this article, balanced accuracy means the unadjusted mean of class recalls, matching scikit-learn’s definition. The missed-patch preset has recalls of 100%, 100% and 50%, so macro recall is 83.33%. The rare class matters as much as either larger class in this summary. [3]
Macro F1 averages the individual class F1 scores; it is not the F1 calculated from macro precision and macro recall. Support-weighted averages weight classes by their reference counts. In a complete, single-label evaluation over all classes, support-weighted recall equals OA, so reporting both does not provide an independent diagnostic. [2]
A pixel-count OA is area-weighted for this complete equal-area grid. That interpretation does not automatically transfer to a benchmark’s selected labelled pixels. Oversampling rare classes changes the evaluation distribution. A class-balanced test set measures a different mixture from the mapped landscape, and equal numbers per class do not make it an area estimate.
For map-area inference, sampling and analysis must agree. Olofsson and colleagues recommend probability sampling, an appropriate reference-labelling protocol, area-proportion error matrices and uncertainty estimates. With map-class strata, a stratum’s mapped area fraction weights its estimated reference-class proportions. Naively treating all sampled labels as equally representative can misstate area accuracy. [4]
Change prevalence without pretending to collect more data
The prevalence control asks a counterfactual question: what would these conditional error rates imply if Rare occupied a different share of the population? It reweights each reference row, keeping the prediction distribution within that row fixed. Background and Region retain their relative 18:5 prevalence ratio within the non-rare remainder.
Select “False islands”, then lower hypothetical rare prevalence. The false-positive rate within Background stays fixed, yet false positives become a larger share of rare-class predictions. Rare precision falls. Macro recall stays fixed because every class’s conditional recall was held fixed; OA changes because the population mixture changed.
This is an arithmetic sensitivity analysis. It assumes that conditional errors remain stable under the prevalence change, which real sensor, geography or acquisition shifts may violate. The control neither changes the displayed 576-pixel map nor supplies an area estimate or confidence interval for an actual landscape.
Give boundary quality its own measurement
Class IoU compares all pixels of a class. A boundary error can therefore occupy a small fraction of a large region. Cheng and colleagues introduced Boundary IoU to compare near-boundary portions of predicted and reference masks, making boundary differences more visible in segmentation evaluation. Their paper studies object-centric segmentation; applying the idea to a class-level HSI mask requires stating the chosen protocol. [5]
Here, the inner band is the class mask minus its erosion by a square neighbourhood of radius d. Pixels beyond the image are treated as background. Boundary IoU is the intersection of reference and prediction bands divided by their union. The selected width is a fixed one, two or three pixels, not a tolerance selected to make a method look better.
For the one-pixel Region shift and a one-pixel band, the band intersection contains 18 pixels and the union contains 62. Boundary IoU is 29.03%, alongside mask IoU of 81.82%. The two measurements are deliberately sensitive to different supports. A wider band changes the question; retain the same width and border treatment when comparing maps.
Real evaluation also needs the spatial sampling distance and registration uncertainty. One pixel means different distances for different sensors. A strict band can penalise a small registration offset or an uncertain reference edge. Report sensitivity to justified widths, without tuning the final choice on the test result.
Treat connected regions as diagnostics, not object identities
The workbench reports connected components of Rare under four- or eight-neighbour connectivity. Four-neighbour connectivity joins edge-sharing pixels; eight-neighbour connectivity also joins diagonals. The generated false islands are separated even under eight-neighbour connectivity, so their counts are deliberately stable. Other maps need not be.
Component count and component-size distribution can expose fragmentation or scattered additions. They do not establish object precision or object recall. A connected land-cover patch can contain several physical objects, and one object can occupy several disconnected labelled patches.
An object-level assessment needs instance annotations and a matching rule: overlap or distance criteria, one-to-one assignment, and explicit treatment of splits and merges. Likewise, a total component count can agree while the locations are wrong. Use the count to guide inspection, alongside the map and class errors.
Make missing support and reference uncertainty visible
Precision is undefined when a class has no predicted pixels. Recall is undefined when it has no reference pixels. If a class appears in the reference but is never predicted, its recall, F1 and IoU are zero. When it appears in neither map, F1 and IoU are undefined too. [2]
Set missed rare pixels to 24 and false islands to zero. The table displays undefined rare precision and zero rare recall, F1 and IoU. This workbench excludes undefined values from each macro average and prints the precision denominator. That convention can make macro precision look reassuring when a class disappears, so the per-class table must remain visible. A library configured to replace undefined values with zero will give different averages.
Outside this synthetic scene, an unlabelled pixel is not automatically background. Define an evaluation mask, report its coverage and keep unknown regions out of both denominators unless they have an explicit reference label. Check spatial alignment, annotation date, mixed-pixel rules and class definitions before interpreting disagreement as model error.
Reference uncertainty and sampling uncertainty are separate. More sampled pixels cannot repair a systematically incorrect reference. For uncertainty intervals, describe the sampling or resampling unit and its dependence assumptions; neighbouring pixels should not simply be treated as independent replications. Record uncertain or disputed labels and any adjudication procedure. [4]
Build a report that supports a decision
Choose the target use before selecting the headline metric. Missing a scarce material, creating false detections and displacing a field boundary can have different consequences. A single weighted score is defensible only when its trade-offs are explicit; it should not hide the underlying errors.
For a fine-grained HSI classification report, keep the evaluation contract beside the results. Show reference and prediction maps at the same scale, the disagreement map, the confusion matrix and the class support. Add boundary or connected-region diagnostics when the task needs them, rather than treating every available metric as a new claim of quality.
- Specify the class ontology, evaluation mask, spatial sampling distance, split design and available test support.
- Report the matrix orientation, OA, per-class precision and recall, and at least one clearly defined macro summary.
- Name class exclusions, averaging weights and zero-division conventions. Keep missed classes visible.
- For spatial diagnostics, fix connectivity, boundary-band construction, width and image-edge handling.
- Separate sample performance, area inference and uncertainty; explain which claim the design supports.
- Inspect errors by scene, region or acquisition where the sample design permits. A pooled score can conceal a weak deployment setting.
Frequently asked questions
Is a high overall accuracy sufficient for rare-class mapping?
No. OA weights each evaluated pixel equally. Read the rare class’s support, precision and recall, and check whether evaluation sampling represents the intended population.
Is average accuracy the same as area-adjusted accuracy?
No. A mean of class recalls is class-balanced. Area-adjusted accuracy requires weights and analysis consistent with the map population and sampling design. Define any use of the abbreviation AA.
Does a zero prediction count mean 100% precision?
No. Precision has a zero denominator and is undefined. A reporting convention may replace it with a number, but that choice must be stated alongside recall and class support.
Can Boundary IoU replace per-class accuracy?
It measures agreement of specified boundary bands. It complements class-level errors and mask IoU; it does not measure every aspect of map quality.
Are connected components equivalent to objects?
No. Components depend on the raster labels and connectivity rule. Object-level scores require instance references and a matching protocol.
Are the workbench percentages research results?
They are exact calculations on a constructed 576-pixel label grid. They illustrate measurement behaviour, not the performance of an HSI method or dataset.
References and further reading
- scikit-learn: confusion_matrix (reference rows, prediction columns)
- scikit-learn: precision_recall_fscore_support (averages and undefined values)
- scikit-learn: balanced_accuracy_score
- Olofsson et al. (2014), Good practices for estimating area and assessing accuracy of land change
- Cheng et al. (CVPR 2021), Boundary IoU: Improving Object-Centric Image Segmentation Evaluation
- scikit-learn: Jaccard similarity coefficient / intersection over union
Reader feedback
Reads since 1 October 2026: at least 15 seconds with the article visible, counted once per browser per day. Reactions are anonymous and can be changed.
Loading reader feedback…
Discuss this article
Ask a technical question, challenge an assumption or share evidence from your own work.